One of the great issues that arises in structural geology is trying record three-dimensional data on paper, which is inherently two-dimensional. Usually, students struggle with trying to visualize things in three-dimensions and have a hard time being able to see how two different planes or lines will intersect each other. But why do we care about planes or lines in space?
Quite a few rocks in the world have some form of parallel alignment due a variety of factors. Sedimentary rocks are usually deposited in horizontal layers that are then compacted & cemented together (lithification) to form the layer-cake rocks that we frequently think of, especially when envisioning the US southwest.

Zion National Park, http://www.planetware.com/i/photo/zion-national-park-utah-utzion2.jpg
Metamorphic rocks that have been squished & heated frequently have minerals that either re-align or grow in parallel planes called foliations.

mineralogy students examine metamorphic rocks in Dutchess County, NY
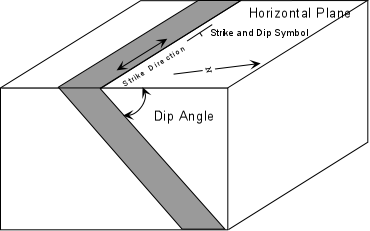
Though the planar features aren’t always exactly flat, we approximate their orientations by describing the strike (general NSEW orientation) and dip (angle from horizontal) of a similar plane.

Lines form in rocks due to several different factors and are recorded as trends (NSEW orientation) and plunges (angle off of horizontal):
- during metamorphism, elongate minerals may re-align or grow in specific directions

lineated gneiss (Callan's foot for scale); http://farm4.static.flickr.com/3075/3109216762_1b7572f138_o.jpg
- a line will form at the intersection of two planes (e.g. a set of sedimentary beds is cut by a fault)

- a group of beds is folded around a hinge axis, that is also a line

Ok, so now at least we have an idea about what kinds of lines & planes might be found in rocks. So, how do we represent them in 2D? We could simply leave them as a list of measurements, but most people when examining:
- N50W, 25 NE
- N74W, 27 NE
- N89W, 32 NE
- N27W, 27 NE
- N9W, 32 NE
wouldn’t be immediately able to tell you whether or not these planes were related to each other by some geologic process or not. In order to plot 3D data in 2D, we use a spherical projection:

Fig. A1.3, Twiss & Moores, 2007
Image a sphere with either a plane or a line going exactly through the center of the sphere. How the plane or line intersects with the exterior of the sphere will depend on its NSEW orientation as well as the angle it is relative to horizontal. When planes intersect the exterior of the sphere, they’re going to form a line, which we’ll call a “great circle.” When a line intersects the exterior of the sphere, its going to be a point called a “pole.” We’re still in 3D, so in order to get to 2D we’re going to image cutting off the top half of the sphere and just using the lower hemisphere. To flatten down to a 2D representation, we’re going to project down from a point (called the zenith) through the equatorial (horizontal) plane to where our plane or line is intersecting the exterior of the sphere.

Fig. H.2, Davis & Reynolds, 1997
If the plane has a steep dip (closer to vertical than horizontal), it will be close to the center of the sphere. For shallow dips, the great circle will plot closer to the edge.
The graph we plot the data on using this method is called a stereographic net or just simply a stereonet.

Let’s go back to the data I gave you earlier. If we were to plot that data as great circles on a stereonet, it would look like:

All the great circles intersect at a pole, which would indicate to a structural geologist that the various planes that were measured may be related to each other. Specifically, the intersection at a point is a strong sign that these planes were folded during the same deformation event.
Stereonets are useful to determine a variety of different things about rocks such as the original orientation of the rocks prior to folding, where an ore-bearing dike might intersect the surface, and whether or not a paleomagnetic signature occurred pre- or post-folding. However, they are not usually intuitive and students frequently struggle a bit until they reach an “ah ha!” moment. I actually always have to do a few every year to get me back into practice, since I don’t use them on a daily basis in my own research. But its like riding a bike: once you’ve learned how to manipulate the data, the methods always come back.
If you want a look at the lab my students will be tackling this week on stereonets, its here.
Anyone have a favorite stereonet story to share?
